Trend Following vs Mean Reversion: How to Evaluate and Combine Both
A practical guide to the two core trading strategy types: how each works, what metrics to use for evaluation, and how to combine them.

A trading bot shows a 35% win rate. Should you worry? Not necessarily. It all depends on the type of strategy it runs. A trend following strategy with 35% winning trades can be perfectly viable; a mean reversion strategy at the same rate would be in serious trouble.
This is one of the most common traps in algorithmic trading: evaluating a strategy with the wrong metrics. Most trading strategies, no matter how sophisticated they appear, fall into one of two categories: trend following and mean reversion. Behind the apparent complexity of indicators and entry rules, one of these two core logics is almost always at work.
Understanding this distinction changes how you evaluate, optimise, and combine your strategies. It is also the first step to avoiding the mistake of discarding a good strategy because you measured it with the wrong yardstick.
Trend Following Strategies: Riding the Move
Trend following strategies rest on a simple hypothesis: financial markets move in identifiable directions over extended periods. The goal is to enter a position at the beginning of a directional move and exit when momentum fades.
Detecting a trend requires two ingredients. The first is a noise filter: random price fluctuations must be smoothed to reveal the underlying direction. Moving averages (simple, exponential, or weighted) fill this role by dampening short-term variations. The second is a measure of strength: a trend without momentum will not carry. Indicators like the RSI (Relative Strength Index), which measures the speed and magnitude of price movements, help confirm that the move has enough energy to be worth trading.
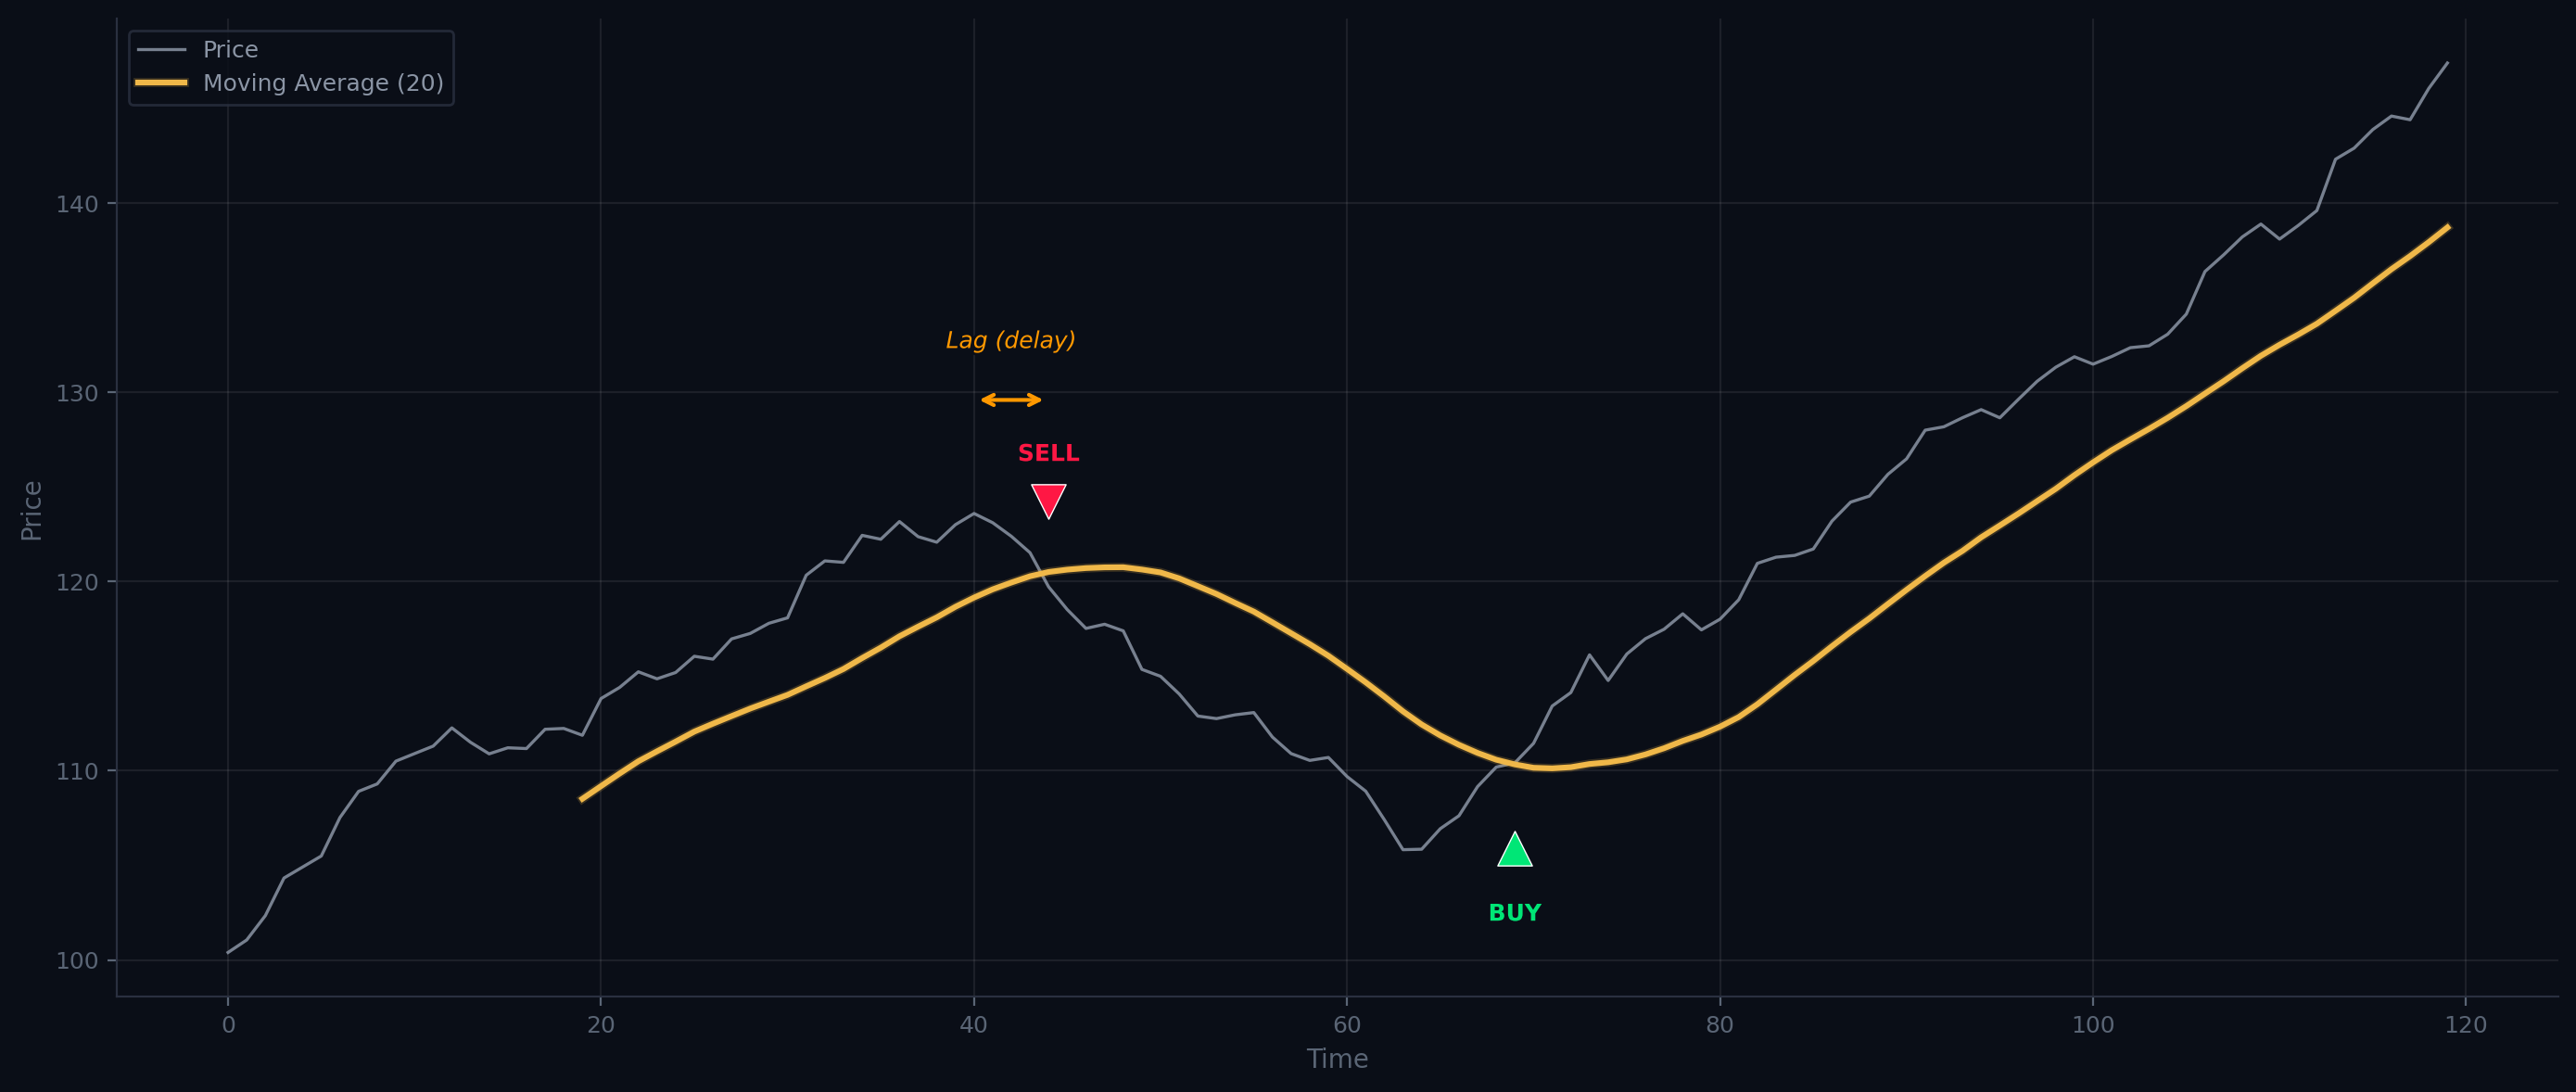
The chart below illustrates this principle: the moving average smooths price fluctuations, and crossovers between price and the average generate entry and exit signals.
How to Evaluate a Trend Following Strategy
Win rate is not the central metric for a trend following strategy. It commonly stays below 50%, sometimes even below 40%. What matters is that average gains on winning trades significantly exceed the average losses. A good trend following strategy loses often but wins big when it is right.
The other dimension to watch is time spent in losing positions relative to time in winning ones. False signals and bad trends are inevitable; what separates a good strategy is its ability to detect and exit them quickly.
As rough benchmarks (to be adjusted to context): a strategy showing a win rate below 35%, average gains that do not exceed twice the average losses, or time in losing positions comparable to time in winning ones, should raise serious questions about its viability.
Limitations of Trend Following
The Achilles' heel of trend following is lag. Using averages mathematically introduces a delay in signals: the longer the averaging period, the better the smoothing, but the greater the delay. With too much lag, the strategy enters a trend too late and exits too late, turning a profitable move into a net loss.
The other enemy is the sideways market (range-bound). Without a clear trend, small bounces generate numerous false signals that gradually erode profits accumulated during directional phases. One solution: pause the strategy during these regimes, either manually or through an algorithmic filter. Range-bound markets often exhibit low volatility; a filter based on ATR (Average True Range) can be enough to identify and skip these unproductive periods.
Mean Reversion Strategies: Trading the Extremes
Mean reversion strategies start from the opposite premise: after a significant deviation, prices tend to revert towards an equilibrium value. An asset that is temporarily overvalued or undervalued relative to its historical average has a high probability of correcting.
Volatility sits at the heart of these strategies. The goal is to spot volatility spikes and abnormal deviations, then position for a return to normal. Moving averages used here are typically very short-period, designed to characterise a recent "normal" price rather than a long-term trend. Statistical tools like variance or the Z-score (which measures how many standard deviations a price sits from its mean) help identify potential reversal points.
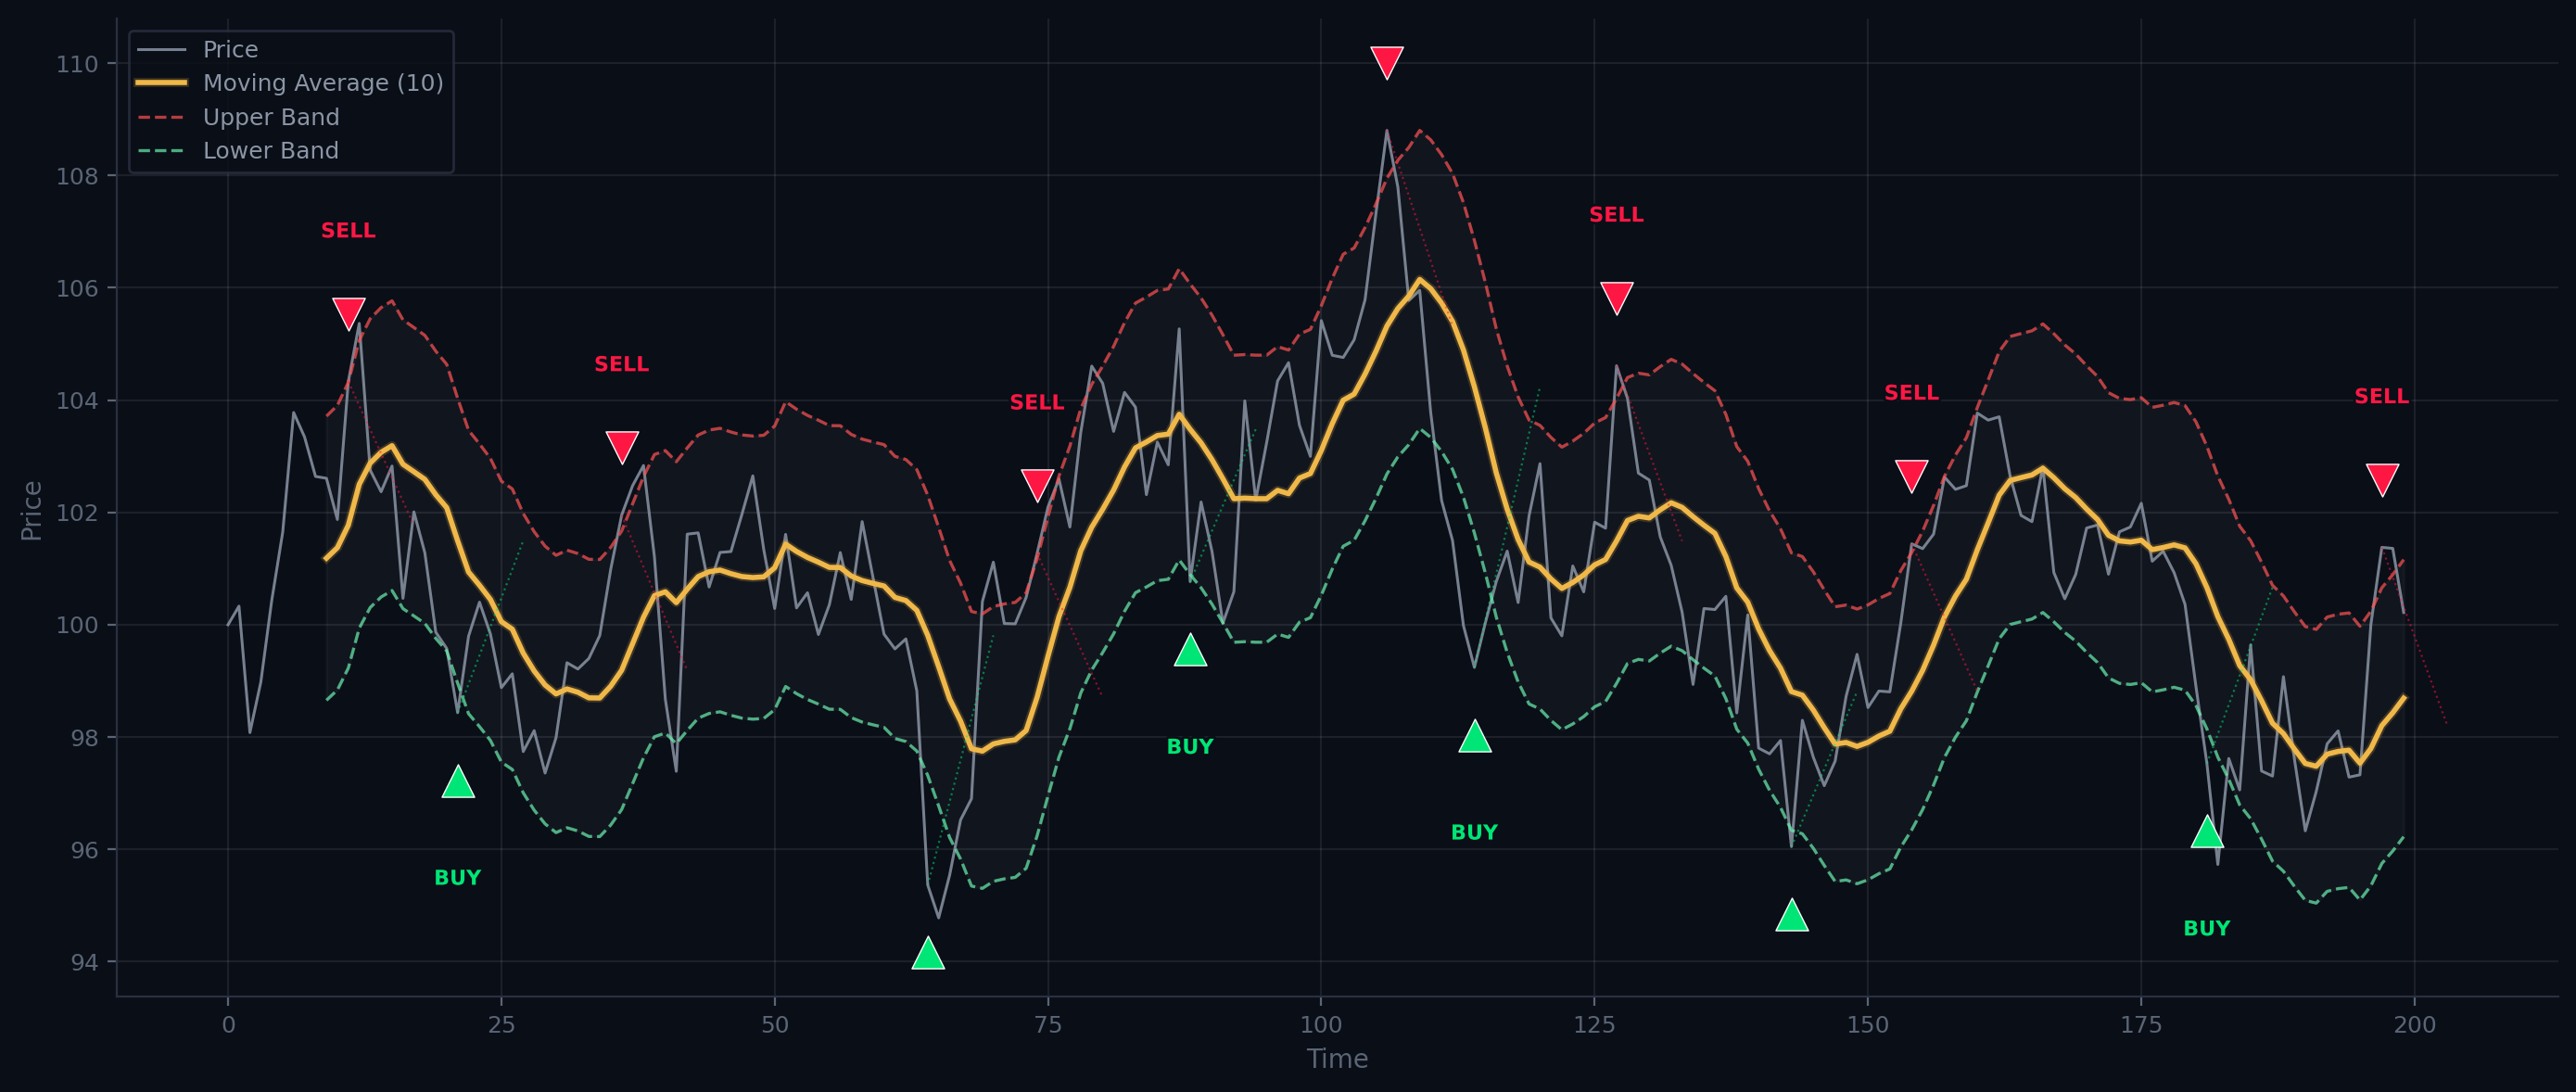
The Envelope strategy is a classic example: it defines bands around a short-period moving average and triggers buy or sell signals when price breaks outside those bands. The chart below shows this mechanism: signals fire at the band extremities and the position closes when price returns toward the average.
How to Evaluate a Mean Reversion Strategy
Unlike trend following, win rate is the key metric here. A rate above 50% is acceptable, but above 60% is preferable. The logic is different: these strategies do not aim for large gains per trade, but rather for accumulating many small wins over time. It is normal for the average loss per losing trade to be close to the average gain.
The ratio between winning and losing streaks is also revealing. If the average number of consecutive winners is not clearly higher than that of consecutive losers, the strategy struggles to recover from its losses. A good mean reversion strategy must be able to string wins together quickly after a drawdown.
One major risk deserves attention: positioning for a mean reversion when in reality a new trend is forming. To avoid getting stuck in a position that keeps sinking, using stop-losses is strongly recommended.
Limitations of Mean Reversion
These strategies are vulnerable to market shocks: an economic announcement or sudden panic can push prices away from their historical average for an extended period. These situations cause steep drawdowns, as the strategy ends up positioned against a powerful move. Periods of sustained trends produce the same effect: the strategy generates reversion signals that never materialise.
To put it simply: mean reversion strategies lose less frequently than trend following strategies, but when they lose, the losses can be severe.
Trading frequency is also worth watching. These strategies open and close positions more often, which means transaction fees weigh more heavily on the bottom line.
Head-to-Head: Trend Following vs Mean Reversion
| Criterion | Trend following | Mean reversion |
|---|---|---|
| Typical win rate | 30-45% | 55-70% |
| Win size | Large (infrequent) | Small (frequent) |
| Gain/loss ratio | High (> 2:1) | Close to 1:1 |
| Trading frequency | Low | High |
| Thrives in | Strong trends | Sideways markets |
| Vulnerable in | Range-bound markets | Trends and shocks |
| Main risk | Erosion from false signals | Sharp drawdowns |
This table highlights the complementarity of the two approaches: the conditions where one suffers are precisely those where the other thrives.
Combining Both Approaches: a Natural Hedge
That complementarity opens a concrete path. Running a trend following strategy and a mean reversion strategy on the same asset simultaneously creates a natural hedge.
During sideways, low-volatility markets, the trend strategy accumulates false signals and small losses. These are exactly the conditions where the mean reversion strategy performs best, profiting from frequent bounces around the average.
Conversely, during strong directional trends, the trend strategy captures large moves while the mean reversion strategy takes losses trying to trade corrections that never come.
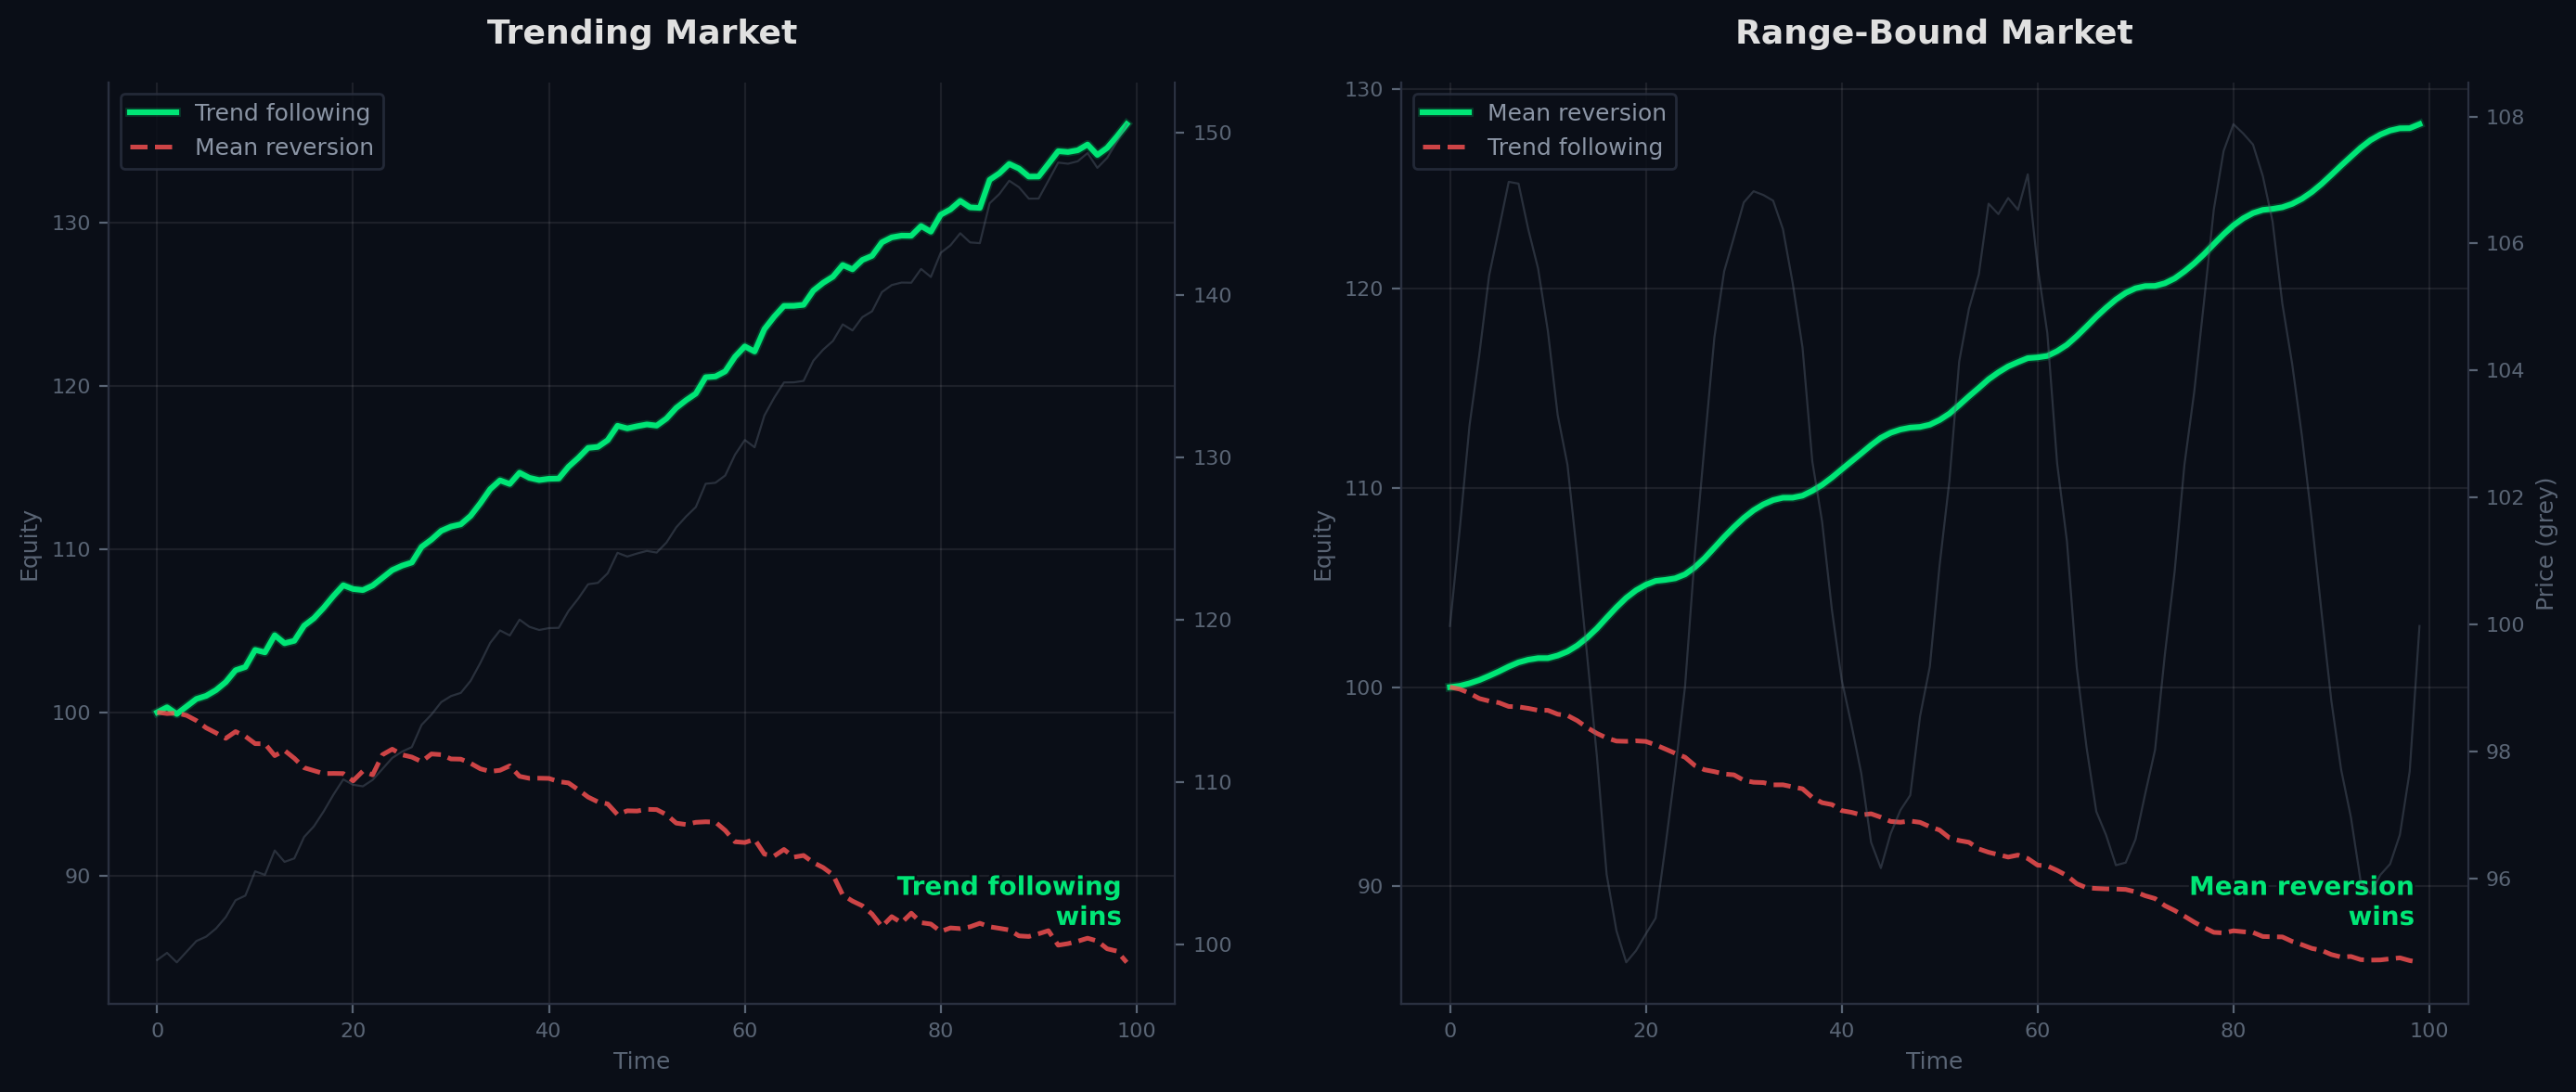
The chart below illustrates this alternation: each market regime favours a different strategy, and together they cover the full spectrum.
The result is not the elimination of risk, but a smoother return profile and less severe drawdowns. Losses from one strategy type are partially offset by gains from the other, smoothing the overall performance curve.
Identify Your Strategy Type: the First Optimisation Lever
The distinction between trend following and mean reversion is not just theoretical taxonomy. It is a practical tool that determines how to evaluate a strategy's health. A 35% win rate is acceptable for trend following, alarming for mean reversion. A 1:1 gain/loss ratio is normal for mean reversion, problematic for trend following.
Before optimising a strategy or discarding it, the first question is: which type is it? The answer shapes the choice of evaluation metrics, the selection of complementary filters, and the hedging strategies available. Starting with this question means avoiding hours of optimisation in the wrong direction.