Heikin Ashi Candles for Crypto Trading: A Complete Guide
How Heikin Ashi candles work, where they mislead crypto traders, and how to build strategies that actually hold up with backtested examples.
Few indicators get recommended as confidently as Heikin Ashi in crypto trading circles. The smoothed candles look reassuring, the trends look obvious, and the screenshots look profitable. Then you trade with real money and the numbers don't match.
The Basics of Heikin Ashi Candles
Origin and History
"Heikin Ashi" translates to "average bar" in Japanese. The technique builds on the long tradition of Japanese technical analysis methods and was designed to reduce market noise by smoothing price fluctuations. It gained traction in Western trading communities in the late 1990s and early 2000s, accelerated by the rise of online trading platforms.
In cryptocurrency markets, where volatility is the norm, Heikin Ashi candles have found a particularly receptive audience. Their ability to filter out noise and clarify trend direction makes them appealing for traders navigating fast-moving digital assets.
Heikin Ashi vs Traditional Candles
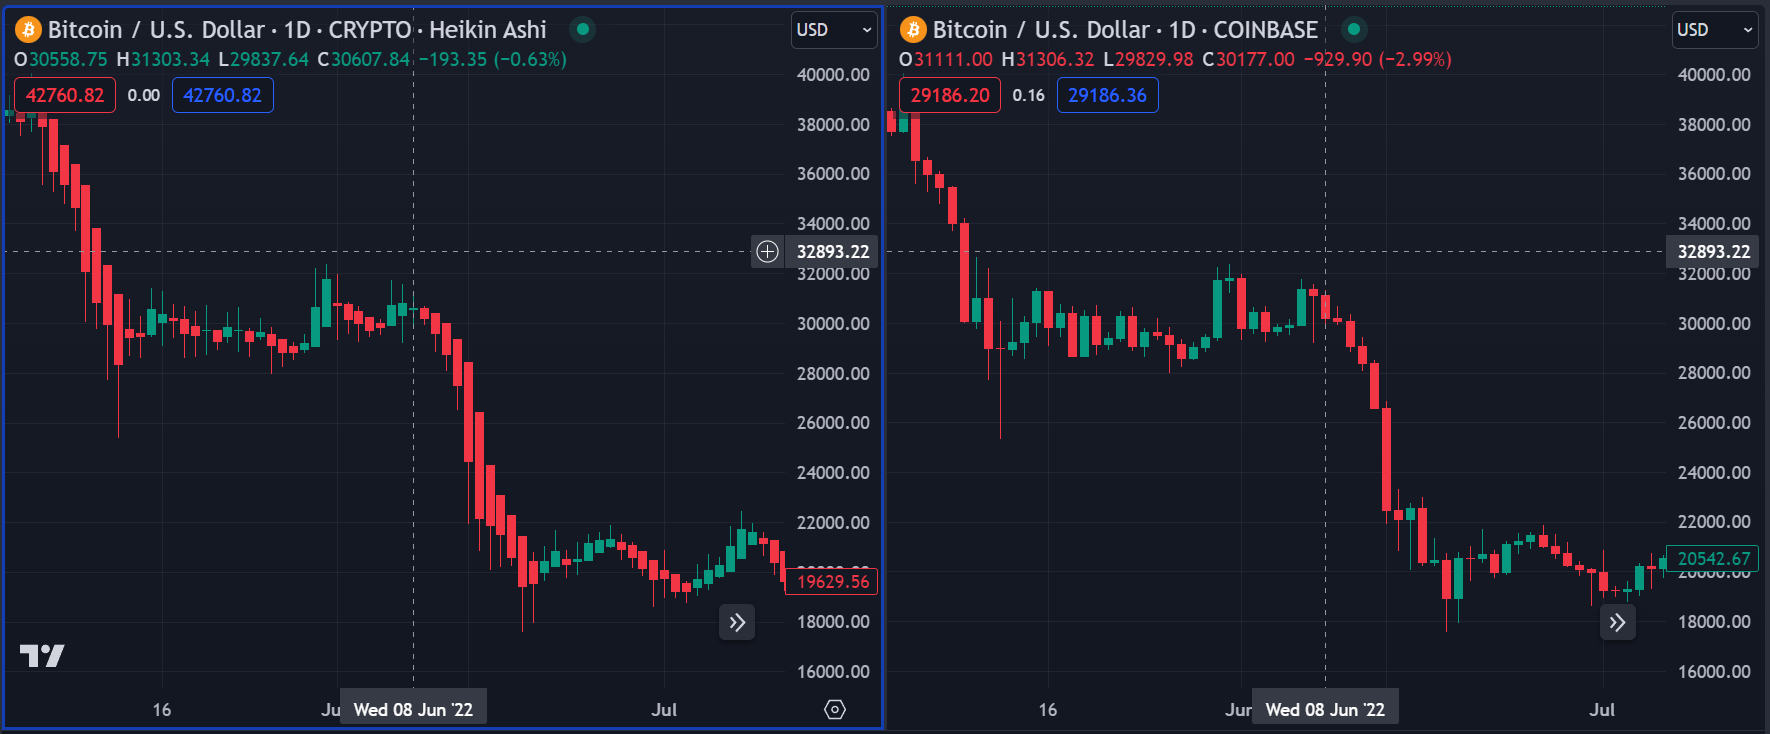
At first glance, Heikin Ashi and traditional candles look nearly identical. The image below shows Bitcoin's daily price in USD represented with Heikin Ashi on the left and traditional candles on the right.
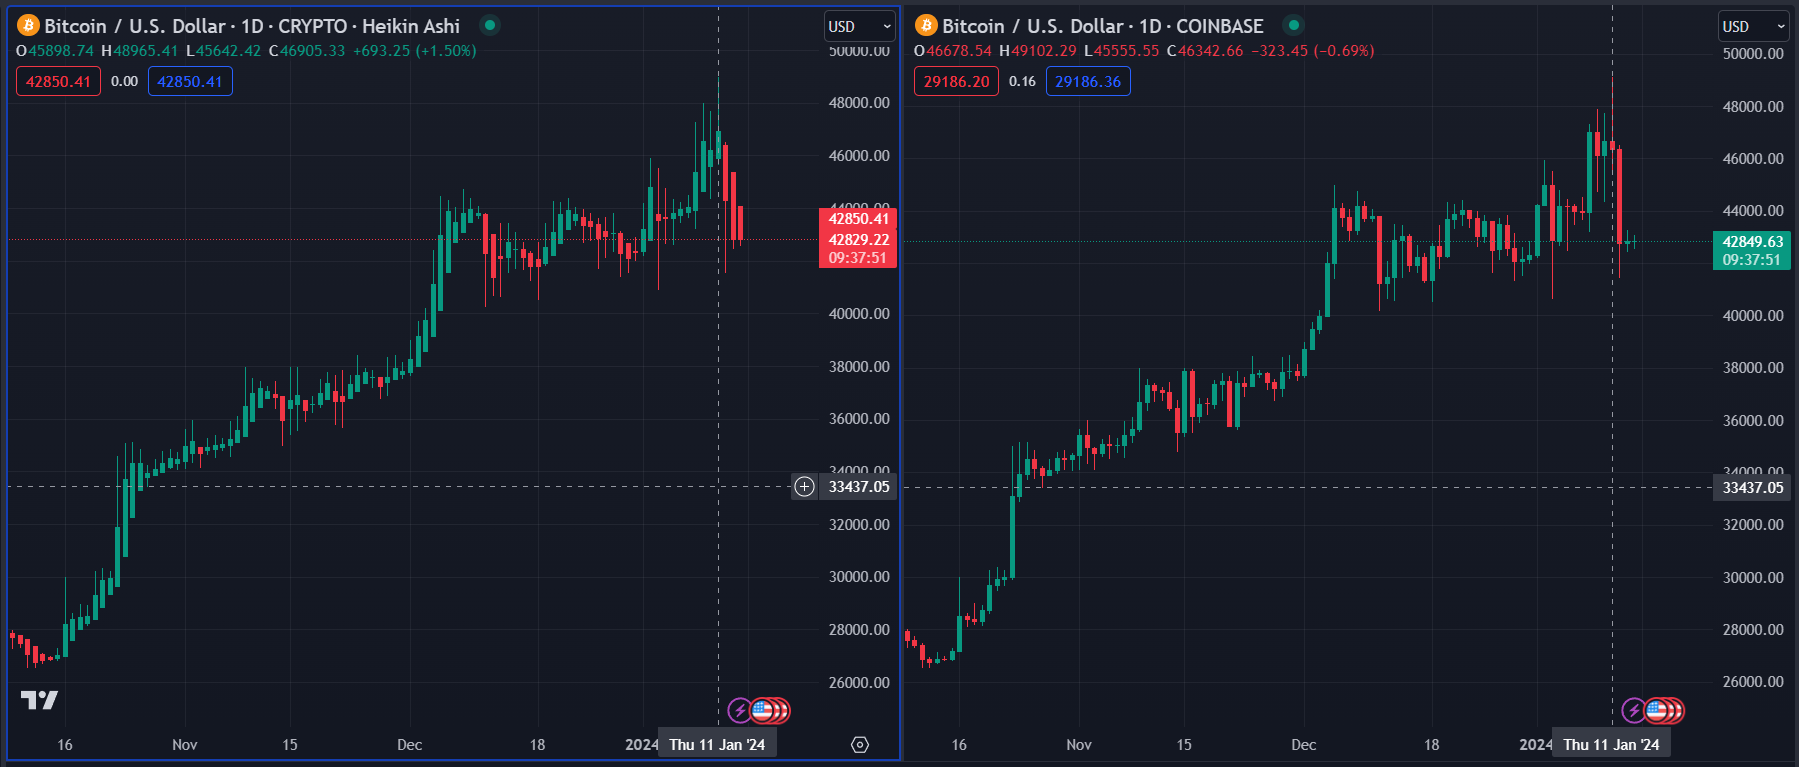
The differences are subtle at first, perhaps a greater colour uniformity with Heikin Ashi. But the two chart types differ fundamentally in construction and interpretation:
-
Construction — Heikin Ashi candles are calculated using averages of the open, close, high, and low prices across current and previous periods. Traditional candles represent exact prices for each period without any smoothing. This is the key distinction: Heikin Ashi values do not represent the asset's actual price.
-
Trend indication — Heikin Ashi candles excel at identifying and confirming market trends by reducing noise. Traditional candles provide more granular information about price movements within a single period, which matters for short-term strategies.
-
Responsiveness — Traditional candles react immediately to price changes, reflecting volatility and reversals in real time. Heikin Ashi candles exhibit a lag due to their averaging method, which can limit their usefulness in strategies that require fast reactions.
-
Visual clarity — Heikin Ashi charts tend to display longer, more consistent colour sequences, simplifying trend identification. Traditional candle charts, with their detailed representation of every price movement, can appear more fragmented.
In short: Heikin Ashi candles are suited for trend overview, while traditional candles are essential for detailed analysis and rapid decision-making.
How Heikin Ashi Candles Are Calculated
The formulas below highlight why Heikin Ashi is an indicator, not a direct representation of price. Each value uses data from both the current and the previous period:
- Heikin Ashi Close — The average of the four main prices (open, close, high, low) for the current period:
- Heikin Ashi Open — The average of the previous Heikin Ashi candle's open and close:
- Heikin Ashi High — The maximum of the current high, the Heikin Ashi open, and the Heikin Ashi close:
- Heikin Ashi Low — The minimum of the current low, the Heikin Ashi open, and the Heikin Ashi close:
These averages smooth price movements and help filter noise, making trends easier to identify at the cost of precision.
Limitations and Common Misconceptions
The Price Discrepancy Problem
Because Heikin Ashi candles do not reflect actual prices, basing entry and exit decisions directly on their values can lead to significant losses.
Consider this example: a strategy enters at the close of the green Heikin Ashi candle indicated in the chart on the left, and exits at the close of the first red candle. On the Heikin Ashi chart, the trade appears to yield a +1% gain. But the actual execution prices, shown on the traditional candle chart on the right, produce a -3.2% loss.
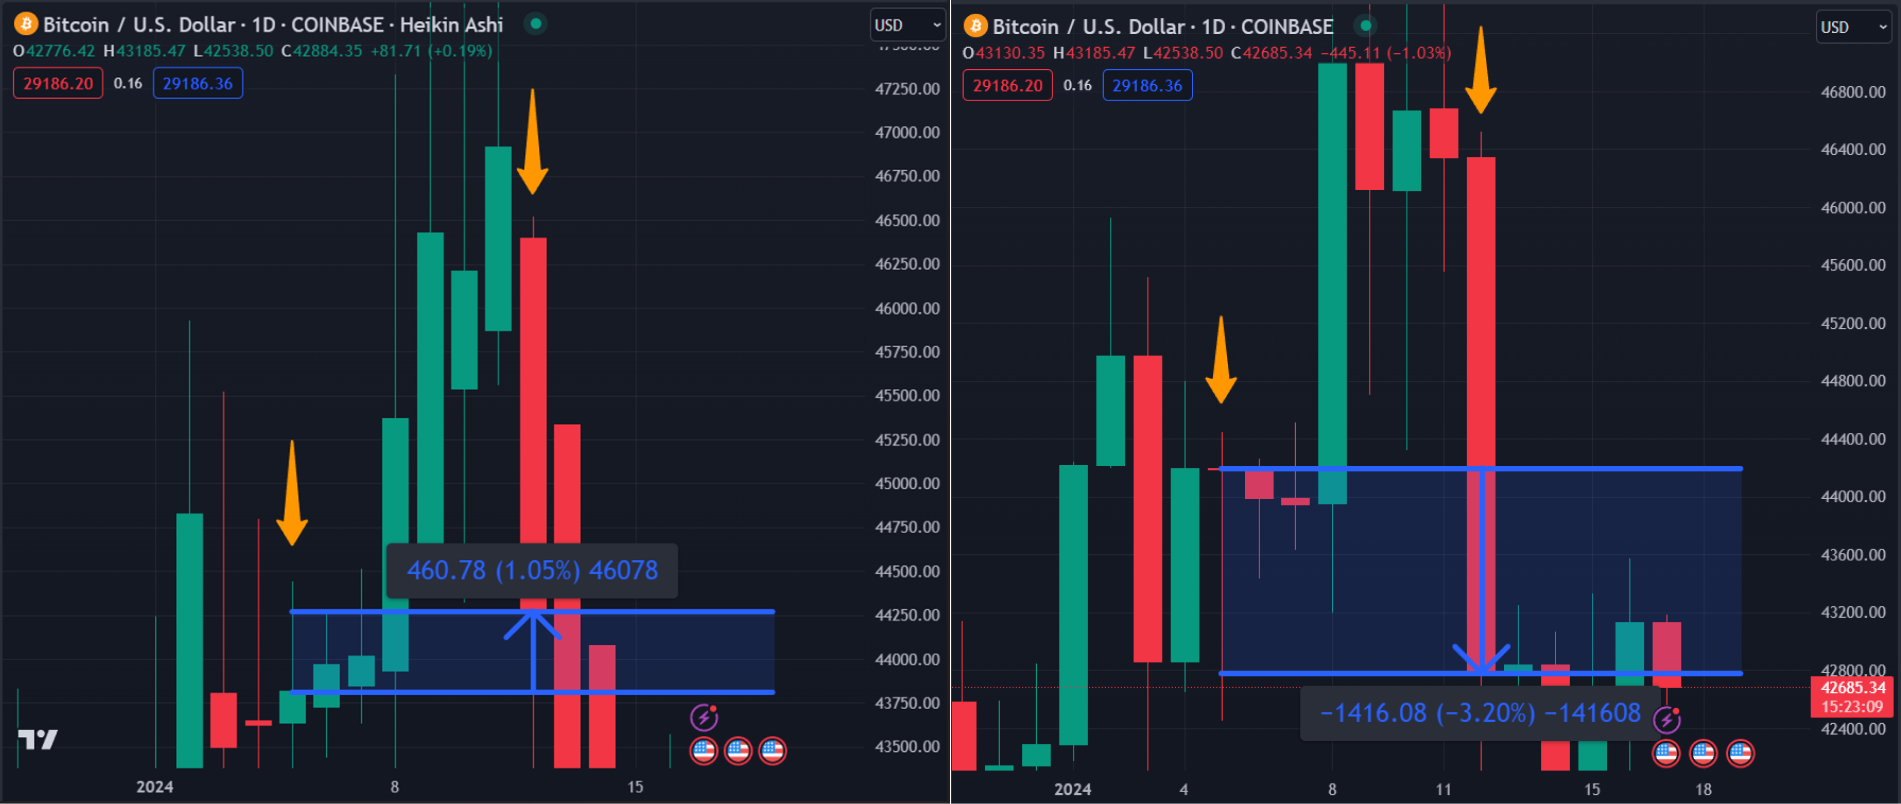
Heikin Ashi is a trend indicator, not a pricing tool.
Debunking Common Myths
One of the most widespread myths is that Heikin Ashi candles can reliably predict market direction at all times. Like any trend indicator, their signal quality deteriorates during periods of high volatility, a frequent condition in crypto markets.
Another misconception is that Heikin Ashi alone provides a sufficient view of the market. The example above demonstrates the risk: trades that appear profitable on Heikin Ashi charts can translate into real losses. Relying on a single smoothed indicator without complementary analysis is a recipe for unexpected drawdowns.
Signal Delay in Practice
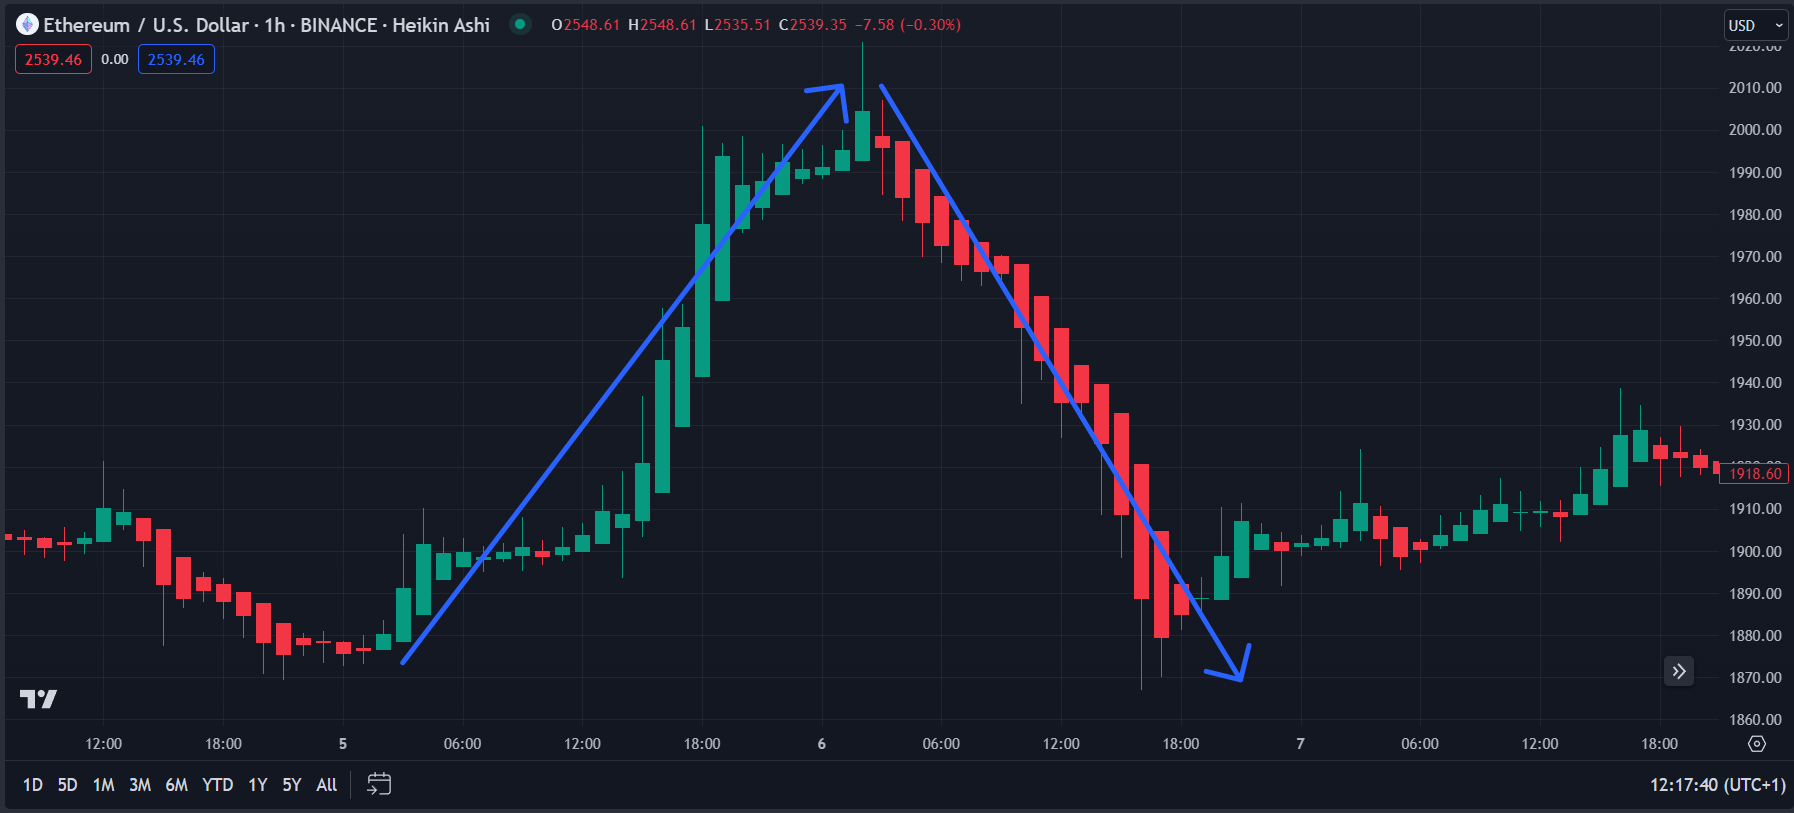
One of the main technical weaknesses is the lag between actual market movements and what appears on the Heikin Ashi chart. The comparison below illustrates this: a sudden downtrend begins two candles earlier on the traditional chart (right) than what the Heikin Ashi chart (left) indicates.
This delay is particularly costly in high-frequency algorithmic trading, where milliseconds matter. The smoothing that makes Heikin Ashi attractive for trend identification can also mask genuine volatility and obscure precise turning points. During sudden price swings, a Heikin Ashi chart might suggest a stable trend while the real price is moving sharply.
For algorithmic traders, this means that relying solely on Heikin Ashi can result in late detection of rapid price movements. Combining it with other indicators helps counterbalance the smoothing and maintain a more accurate view of market dynamics.
Building Strategies with Heikin Ashi
A Simple Strategy and Its Failure
To illustrate correct usage, let's start with an approach that exposes the indicator's limitations before improving it step by step.
Working with BTC/USDT on a 30-minute timeframe and backtesting over 2023 (when Bitcoin rose over 150%), a simple strategy of buying on a green Heikin Ashi candle and selling on the next red one should theoretically profit in a bullish market. Implementing this in Pine Script on TradingView tells a different story.
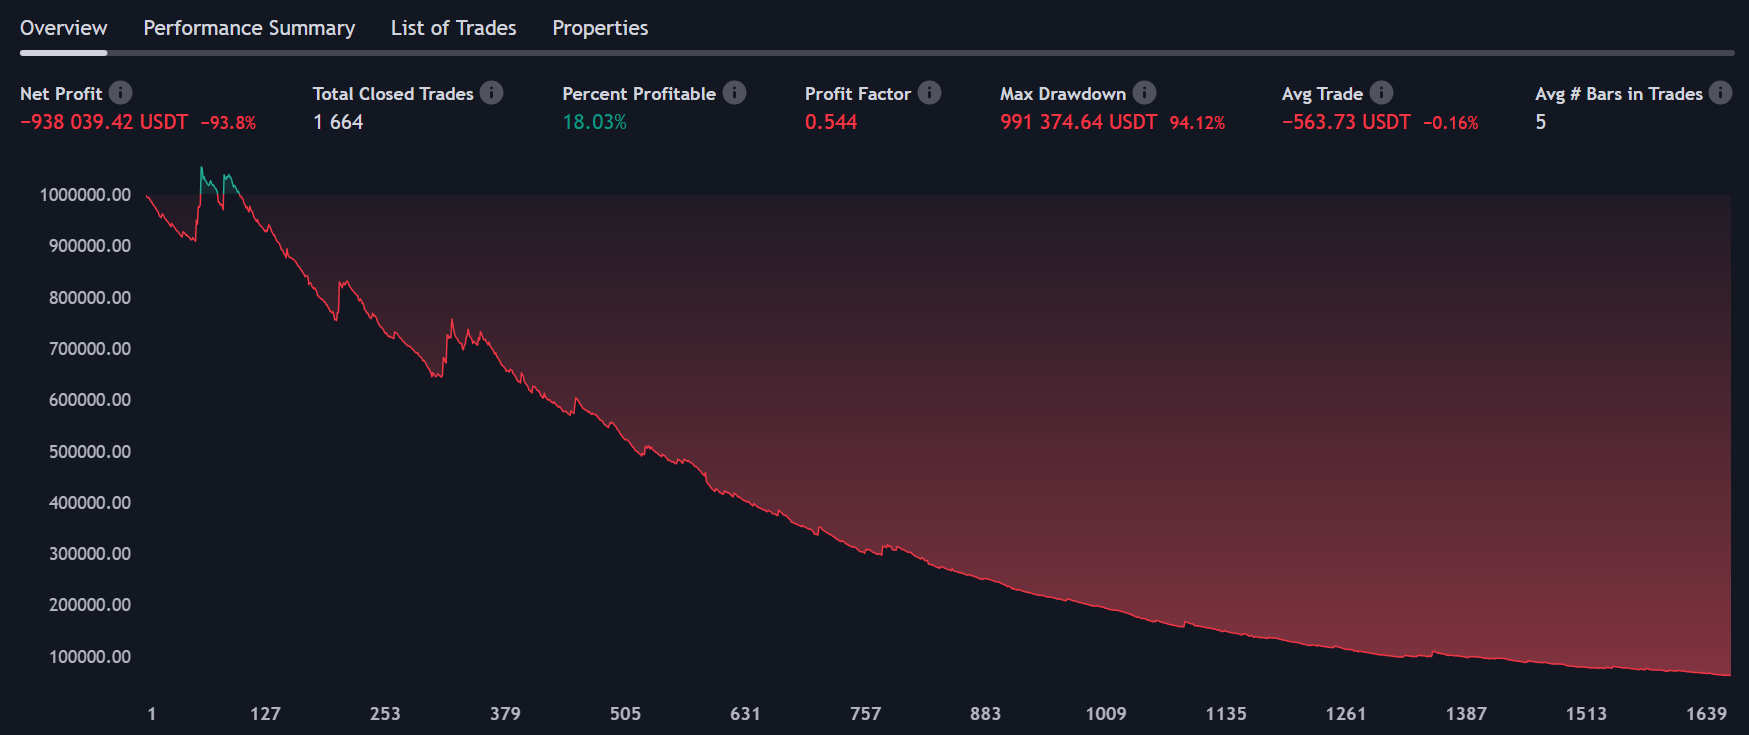
The result is a -93.8% loss over 1,664 trades. The limitations described earlier (false signals, lag, noise during consolidation) generate too many bad trades, wiping out any profit from trending periods.
Adding Risk Management
Instead of exiting on a red candle, keeping the green-candle entry condition but replacing the exit with a take profit and stop loss makes a dramatic difference. The stop loss is set at 5 ATR (Average True Range, a volatility-based measure of how much an asset typically moves per candle) from the entry price, with a risk-reward ratio of 2:
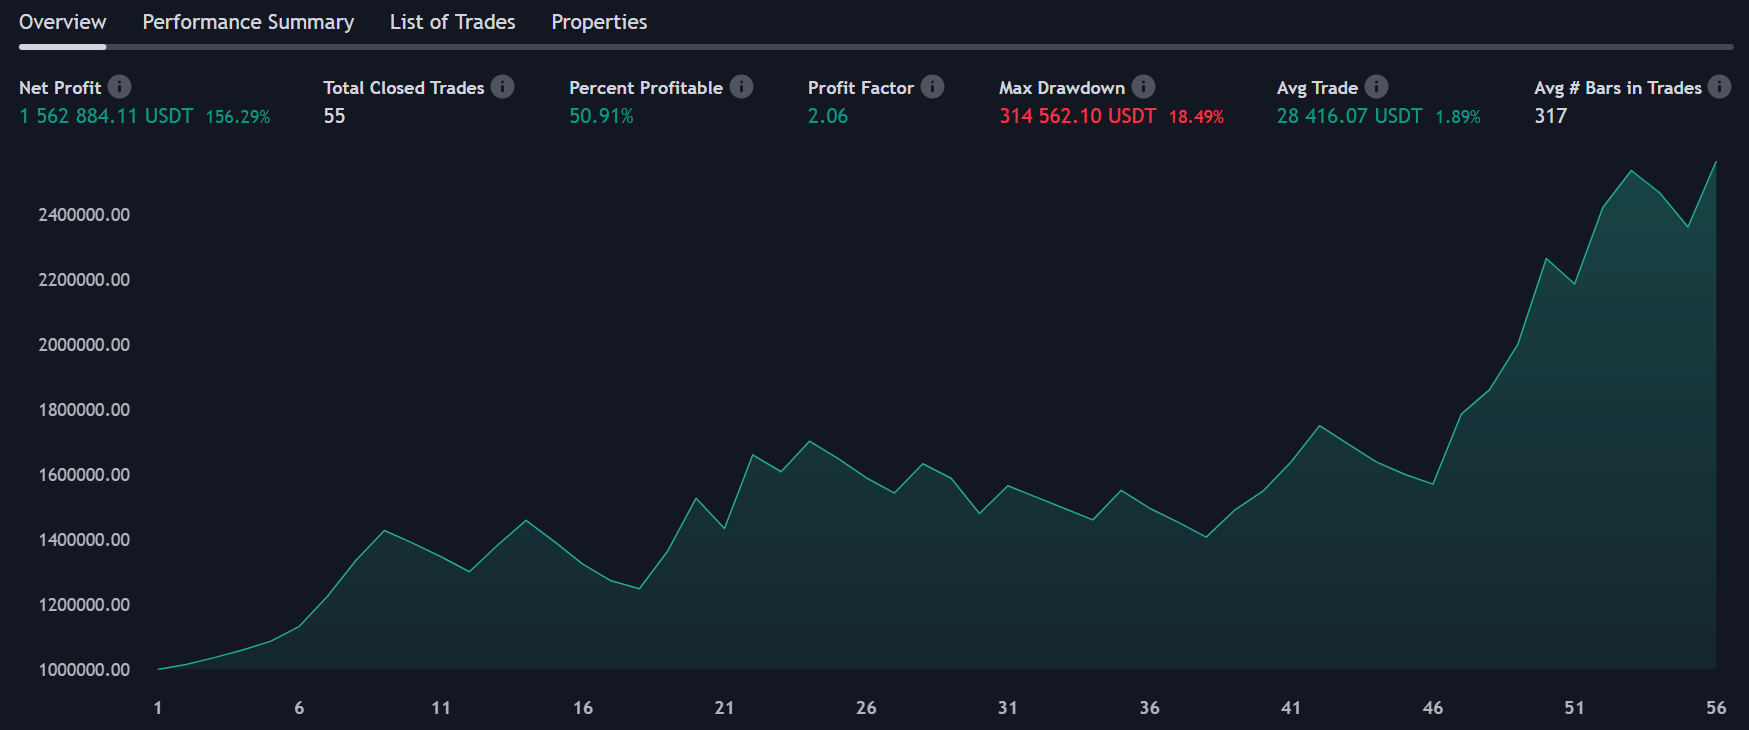
The trade count drops from 1,664 to 55, and the strategy becomes profitable at +156.29% with a profit factor of 2.06. Filtering exits through proper risk management eliminates the noise that destroyed the naive approach.
Combining Heikin Ashi with Supertrend
Adding a confirmation layer with a complementary trend indicator can push results further. Supertrend is a trend-following overlay that plots a line above or below the price; when the price is above the line, the trend is considered bullish, and vice versa. Using it with a multiplier factor of 1 and a period of 40, and requiring the closing price to be above the Supertrend line before entering, produces an improvement:
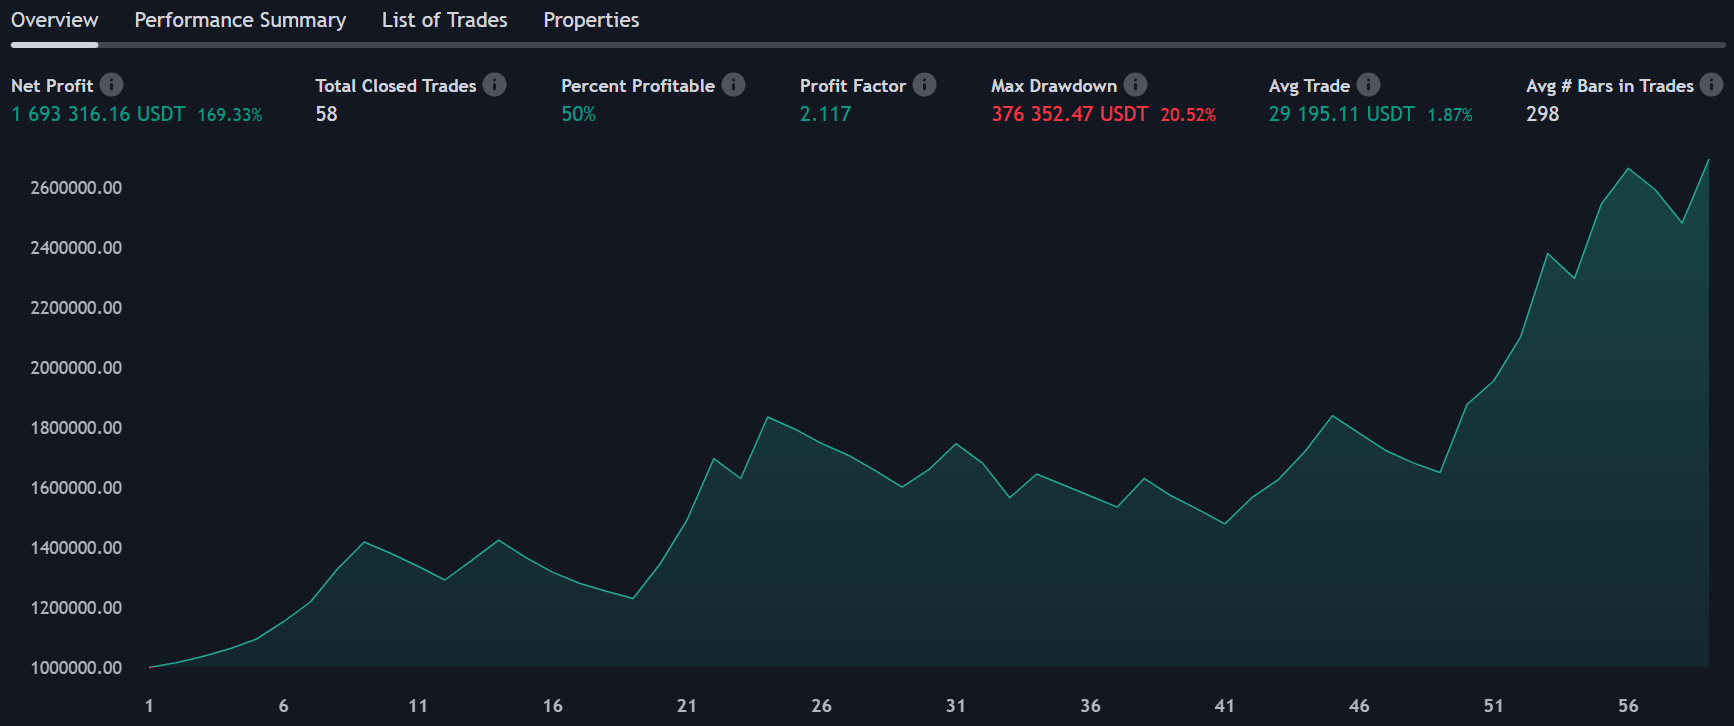
Net profit rises to +169.33% with a slightly improved profit factor of 2.117. This is not a production-ready strategy; more rigorous testing across multiple market conditions would be needed. But it demonstrates the core point: Heikin Ashi works best as one component in a multi-indicator system, not as a standalone signal.
Conclusion
Heikin Ashi candles offer a simplified, smoothed view of market trends that can be genuinely useful for cryptocurrency traders. But their strengths come with clear trade-offs: they do not represent actual prices, they lag behind real market movements, and they can mask volatility that matters for execution.
Used in isolation, Heikin Ashi generates too many false signals to be profitable. Combined with proper risk management (take profit, stop loss) and complementary indicators like Supertrend, the same entry signal becomes the foundation of a viable strategy.
The key takeaway is straightforward: treat Heikin Ashi as what it is, a smoothed trend indicator, and build around it accordingly. It is a valuable component in a broader trading toolkit, not a self-sufficient solution.