Free Python Tool to Analyse Your Bitget Trading Performance
A free, open-source Jupyter Notebook that uses Bitget's tax endpoint to analyse your futures trading performance: PnL, win rates, and per-coin breakdowns.

Whether you trade manually or run trading bots, one question keeps coming back: how well are you actually doing? Which strategy generates positive PnL? Which coins contribute to gains, and which ones should you drop? Are shorts adding value or dragging the portfolio down?
Paid tools exist for this, but this free, open-source Python tool answers all of these questions. In only a few clicks inside a Jupyter Notebook, you can produce PnL charts, win rate breakdowns, and per-coin performance analyses like this:

This tool also serves as a foundation for tax reporting, since it uses the same API routes that paid tax services rely on to compute your trading activity.
All the resources for this tool:
- Standalone Jupyter Notebook — PnL Analysis Bitget on GitHub
- LiveTradingBot library — LiveTradingBots, which has this tool embedded
- Video walkthrough — Trading Bot Performance Analysis on YouTube
How Tax Endpoints Help Analyse Trading Performance
The solution is a Python Jupyter Notebook (an interactive coding environment that combines code, outputs, and notes in a single document) developed for Bitget futures. It is open source and available on GitHub, and you could extend it to other markets or exchanges.
This article focuses on what the tool produces rather than the code internals. I will use a real account where I tested an Envelope strategy trading bot as the demonstration. Once configured (covered in the setup section), running the full analysis takes a single click.
Understanding the Tax Endpoint Data
The code accesses what Bitget calls the Tax Endpoint, a URL storing account data typically used for tax reporting. Access is granted through API keys configured with read-only permissions.
The data retrieved from this endpoint has no time limit: it goes all the way back to account creation. The trade-off is that the type of information is limited. There are no position snapshots at regular intervals, no order details such as stop loss or take profit levels. What you get is a chronological recording of every movement on the account. For full technical details, see Bitget's Get Future Account Record documentation.
The raw data looks like this:
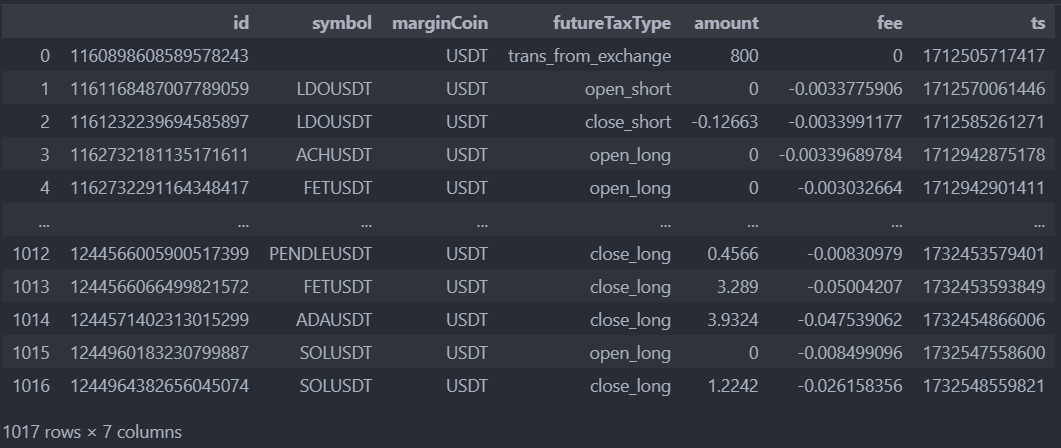
Each row represents an event with the following fields:
- id — event identifier
- symbol — present when relevant for the event type
- marginCoin — the currency in which the amount is expressed
- futureTaxType — event category (opening/closing position, transfer, funding fees)
- amount — the value involved, in units of marginCoin
- fee — trading fees
- ts — event timestamp
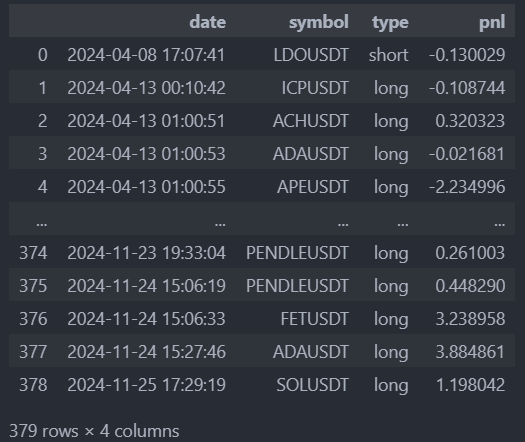
The challenge is to reconstruct meaningful performance metrics from these raw records. The code handles this by separating trades from non-trade events. Calling records_manager.trades displays the isolated trade data:
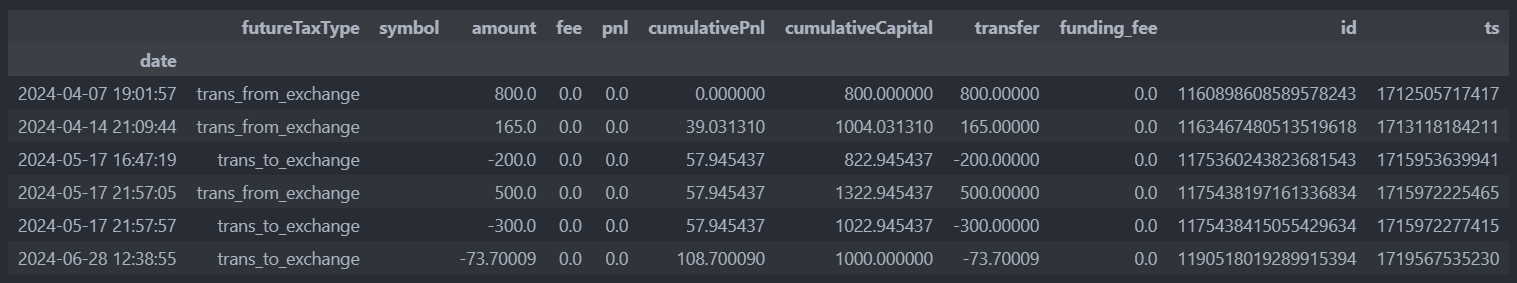
Account management records (transfers, funding fees) are accessible through records_manager.extra_records:
General Performance Analysis
The first thing most traders want is a high-level snapshot. The method records_manager.print_global_analysis() provides exactly that:
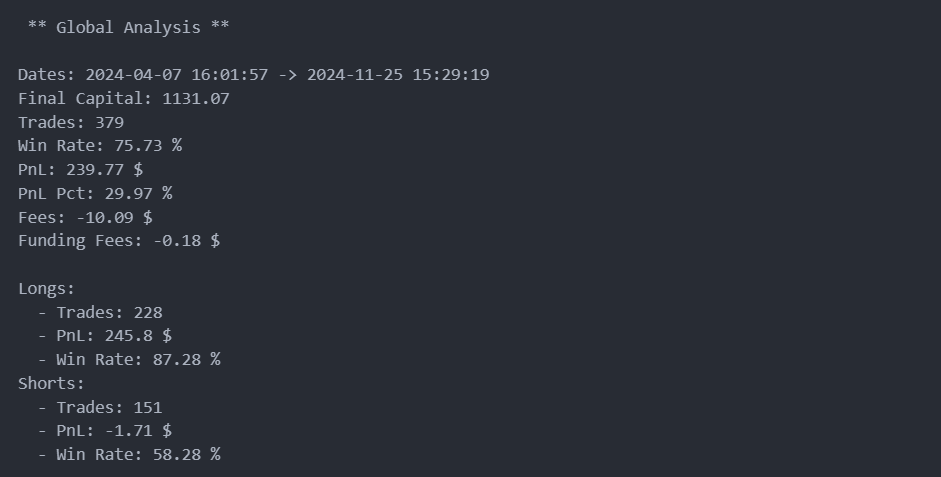
This output includes the analysis period, final capital, trade count, and win rate broken down by overall, long, and short sides. Knowing the number of trades is always a good sanity check: too few trades means the statistics may not be representative of the strategy's general behaviour.
In this example, the very high win rate is characteristic of the Envelope strategy. Mean reversion strategies that hunt fast volatility corrections typically need a win rate above 70% to remain profitable; the high hit rate compensates for the occasional larger loss.
The breakdown by trade side reveals something valuable: shorts are mostly losing money in this configuration, with negative PnL and a win rate that is too low. One could conclude to simply stop the bot from entering shorts, or revisit the parameter configuration for the short side. The long-side performance alone remains attractive and could probably be further optimised with this improvement.
Visualising Performance Over Time
Statistics provide a summary; charts reveal the full story. The method records_manager.plot_over_time() accepts a metric parameter (PnL, Pnl Pct, or Capital) to produce the corresponding chart:
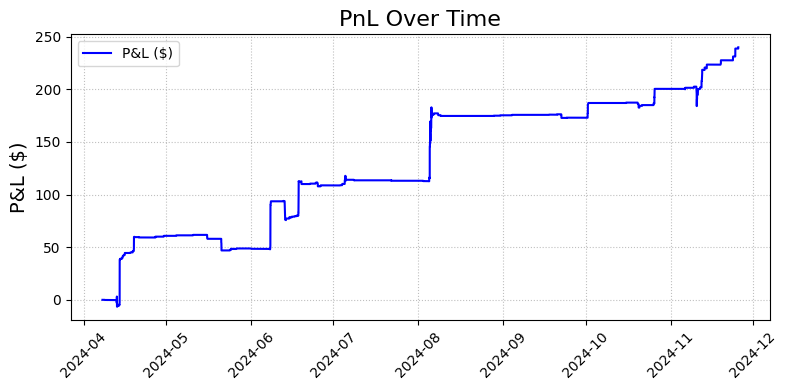
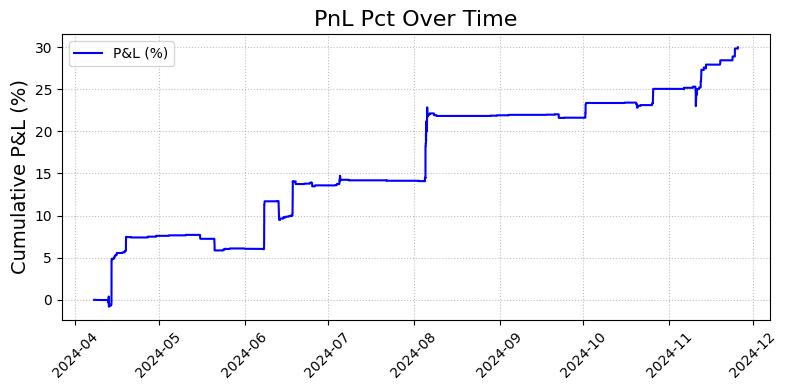
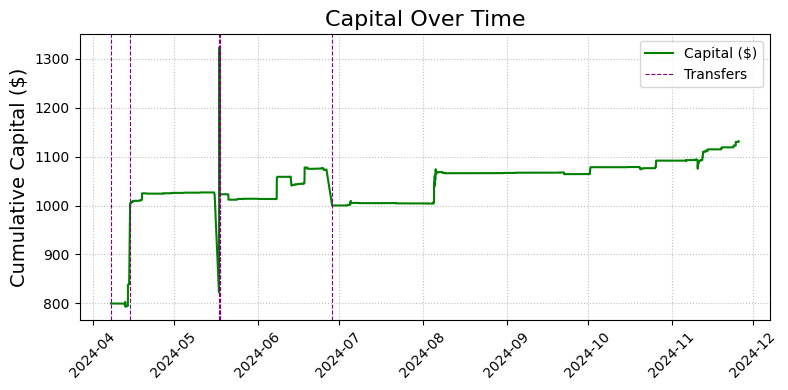
The show_transfers=True option marks fund transfers on the chart, which prevents confusing capital jumps caused by deposits or withdrawals with actual trading gains.
These curves show a pattern typical of the Envelope strategy: gains arrive in sharp bursts rather than smooth increments. Crypto assets tend to be correlated, and that correlation extends to volatility anomalies. When multiple coins correct at the same time, the strategy captures several trades at once. The flat horizontal stretches correspond to a quiet market period with little activity and no trade signals.
Analysing Per-Pair Performance
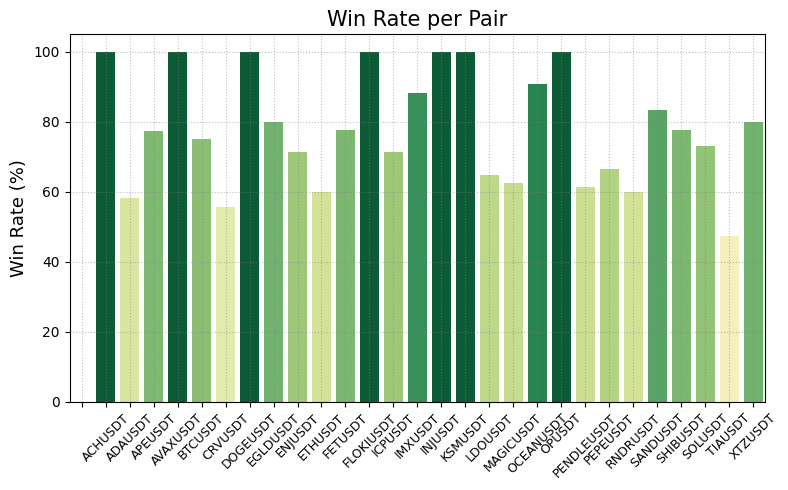
Portfolio-level metrics tell one story; per-coin breakdowns tell another. Before drawing conclusions on any pair, check how many trades support the analysis. The method records_manager.plot_per_pair(metric="Trades") provides this:
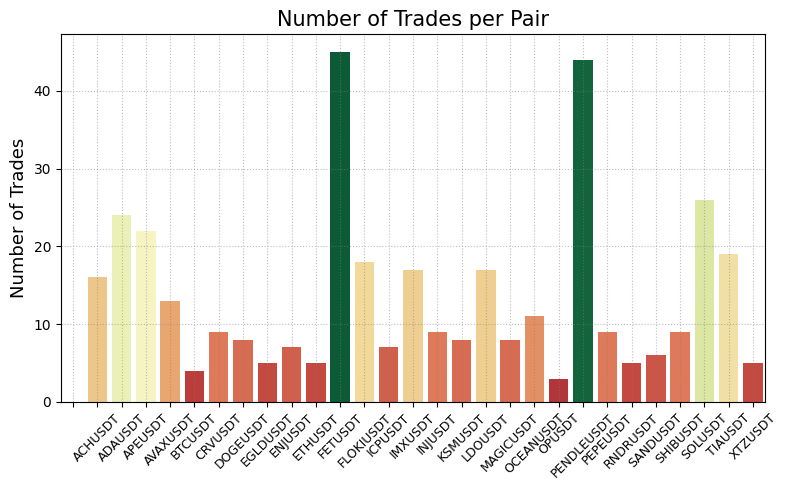
Many coins have too few trades for confident conclusions. Among those with sufficient data, the PnL per pair chart highlights the standouts:
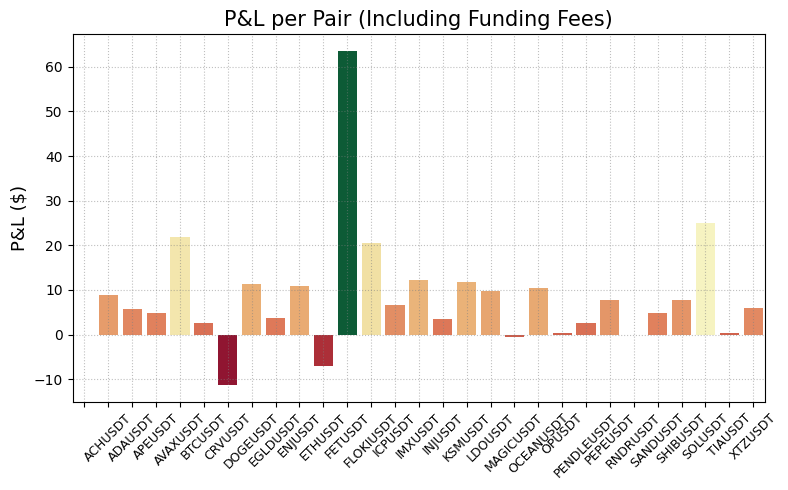
FETUSDT performed well and could warrant keeping its parameters or increasing its capital allocation. PENDLEUSDT, despite a decent trade count, significantly underperformed, pointing towards a parameter change or removal from the strategy. SOLUSDT shows promising early results worth monitoring.
The analysis can go even deeper. The method records_manager.plot_per_trade_type() breaks down any metric by long and short for a specific pair. For ETHUSDT:
Longs had a strong win rate while shorts performed poorly. The low overall win rate spotted earlier for this pair is not general overfitting; the short side is dragging down the long side's performance. The envelope parameters that work well for longs simply do not transfer to shorts on this pair.
When a coin's live win rate drops well below what backtesting predicted, this can be a red flag for overfitting: parameters tuned too closely to historical data that fail to adapt to new market conditions.
Setting Up the Trading Analysis Notebook
The tool runs as a Jupyter Notebook in VSCode, a free code editor. If you need help installing Python and VSCode, follow this setup tutorial.
The first notebook cell contains all the imports, functions, and classes. Nothing to modify; just run it.
Configuring the API Key
The second cell holds the account configuration:
api_setup = {
"apiKey": "",
"secret": "",
"password": "",
}
portfolio_start_date = "2024-03-01"
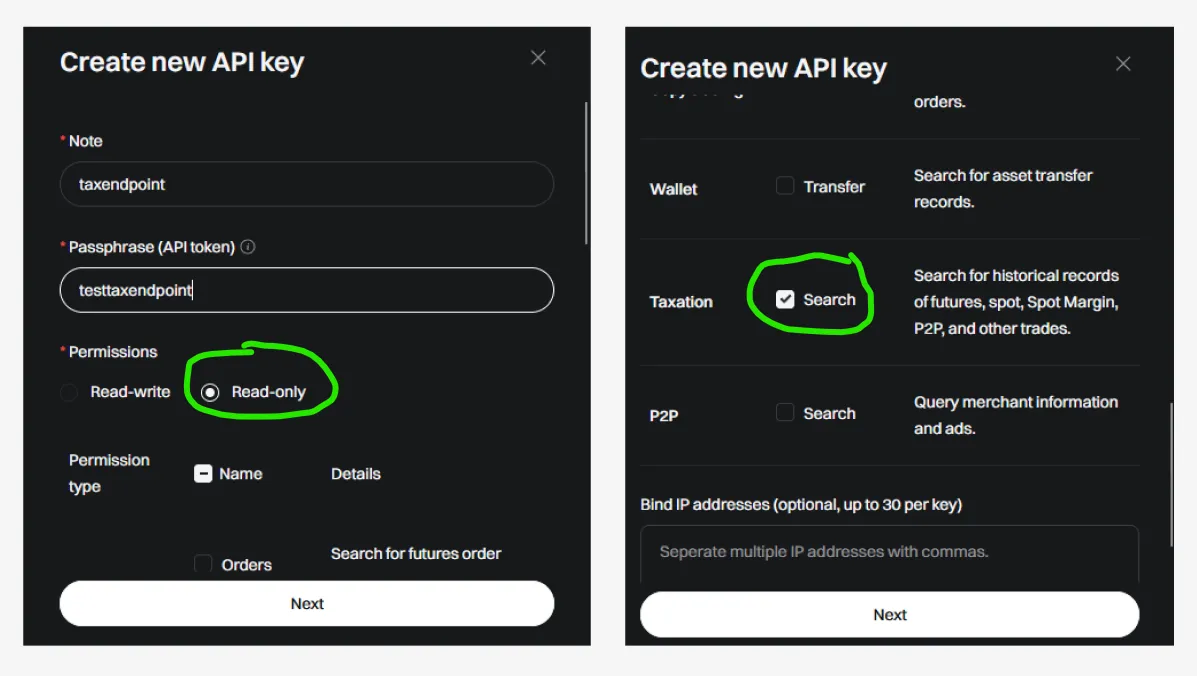
records_manager = RecordsManager(api_setup, portfolio_start_date)Fill api_setup with the API credentials of the account you want to analyse. Since the tool only reads data, the key requires only read permissions. Under taxation permissions, check the search item as shown below:
For a step-by-step guide on creating a Bitget API key, see this video walkthrough.
The portfolio_start_date must be set to the earliest date of activity on the account. Setting it to a later date means the code will miss older records, producing incorrect capital reconstructions and PnL calculations. The reconstructed final capital would differ from the actual balance on your account.
Running and Customising the Analysis Window
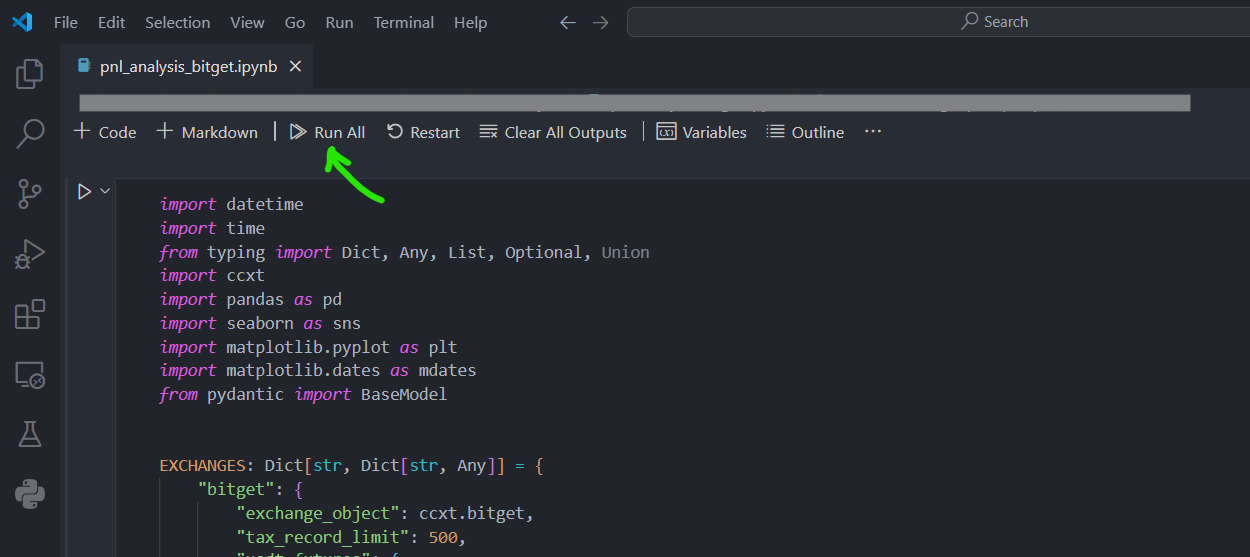
Once configured, click "Run All" in VSCode to execute every cell at once:
While portfolio_start_date must cover the full account history for correct reconstructions, the analysis window itself is flexible:
records_manager.analyse()  # Full period

records_manager.analyse(start_date="2024-07-01")  # From a specific date

records_manager.analyse(start_date="2024-07-01", end_date="2024-11-10")  # Specific range
This is useful for monthly, weekly, or yearly reporting. Comment or uncomment the line you need, and all subsequent cells (the plots and statistics covered above) execute automatically. Feel free to reorganise the cells and plots to produce the analysis that best fits your needs.
Sources
- Bitget, "Get Future Account Record," API Documentation
- RobotTraders, "PnL Analysis Bitget Notebook," GitHub
- RobotTraders, "LiveTradingBots Library," GitHub
- RobotTraders, "Envelope Strategy Trading Bot," YouTube